

Introduction to JavaScript Debugger
Javascript debugger is used to find out coding errors in the program. While we are writing some new programming code, there may be a chance to encounter some errors. These errors may be syntactical or logical. It is very difficult to find out where the error is all the time because if I have 10 thousand lines of code, is it easy to analyze that where the error occurs manually? No right. In this kind of situation, we have a feature called debugging in any programming language.
How does Debugger Work in JavaScript?
In JavaScript debugging can be achieved in 2 ways:
1. By Using the Debugger Keyword
- This debugger keyword is used in browsers like Chrome, Firefox, Internet Explorer, etc.
- Wherever we predict errors occur, there put a debugger.
- While executing the code, instead of executing the entire code, the compiler pauses the execution at the debugger.
- With this, we can step by step analyze where the error occurs exactly.
Console Tab:

Syntax:
var a=10;
debugger;
for(let i=0;i<=10;i++)
{
//code
}
Debugger mode looks like below:
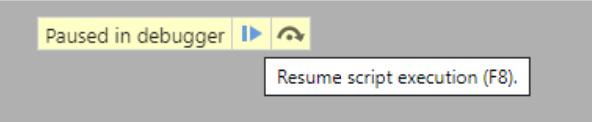
When we used the debugger keyword in our code, if we press the F12 button and Run the code, we will get debugger mode as above. The first blue color button is used to Resume (come out of the debug) the code.
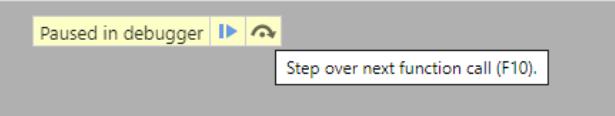
The second black color button is used to move step by step line execution of code.
2. By Using Breakpoints
- These breakpoints are used in IDE’s instead of using the debugger keyword.
- Wherever we predict errors occurs there put breakpoint.
- While executing the code, instead of executing the entire code, the compiler pauses the execution at the debugger.
- With this, we can step by step analyze where the error occurs exactly.
In Eclipse IDE breakpoints look like below:
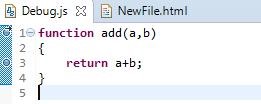
You can see 1 and 3 lines have breakpoints with circles.
Examples of JavaScript Debugger
The topic is about debugger so we will look into examples with debugger keyword:
Example #1 – Palindrome with Debugger Keyword
Code:
<!DOCTYPE html>
<html>
<body>
<font color="blue"><h1 align="center">Palindrome with Debugger</h1></font>
<script>
function palindromeOrNot()
{
var remainder,total=0,actualNumber;
var input=77877;
actualNumber=input;
while(input>0)
{
debugger;
remainder=input%10;
total=(total*10)+remainder;
input=parseInt(input/10);
}
if(actualNumber===total){
document.write(actualNumber+": is palindrome number ");
}
else   {
document.write(actualNumber+": is not palindrome");
}
}
palindromeOrNot();
</script>
</body>
</html>
Output paused at debugger:

Final Output:
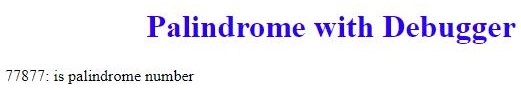
Explanation:
- When we press F12 and run the code then code moved to debugger mode as above.
- Once we click on step over the next function call or F10 then code moved from debugger to next line, keep on pressing until we figure out any errors.
- If no errors encountered, then code automatically comes out of the debug mode prints the output.
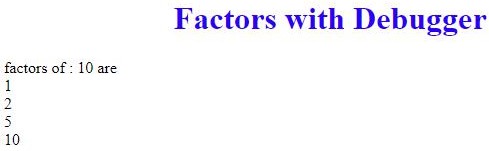
Example #2 – Factors with Debugger Keyword
Code:
<!DOCTYPE html>
<html>
<body>
<font color="blue"><h1 align="center">Factors with Debugger</h1></font>
<script>
function factors()
{
var input=arguments[0],j=1;
document.write("factors of : "+input+" are ");
document.write("<br>");
while(j<=input)
{
debugger;
if(input%j==0){
debugger;
document.write(j);
document.write("<br>");
}
j++;//post increment operator
}
}
factors(10);
</script>
</body>
</html>
Output paused at debugger:

Final Output:
Explanation:
- When we press F12 and run the code then code moved to debugger mode as above.
- As you can see in the above code, we can use more than one debugger keywords in a single program.
- Once we click on step over the next function call or F10 then code moved from debugger to next line, keep on pressing until we figure out any errors.
- If no errors encountered, then code automatically comes out of the debug mode prints the output.
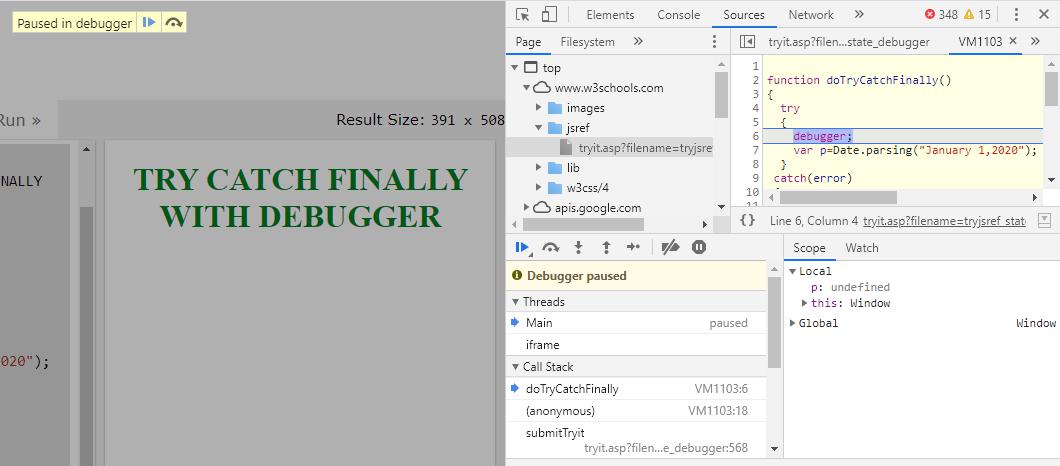
Example #3 – Try, Catch and Finally with Debugger Keyword
Code:
<!DOCTYPE html>
<html>
<body>
<font color="green">
<h1 align="center">TRY CATCH FINALLY WITH DEBUGGER</h1>
</font>
<script>
function doTryCatchFinally()
{
try
{
debugger;
var p=Date.parsing("January 1,2020");
}
catch(error)
{
document.write(error+"<br>");
}
finally
{
document.write("I can kill or close connection even any errors thrown in the code");
}
}
doTryCatchFinally();
</script>
</body>
</html>
Output paused at debugger:
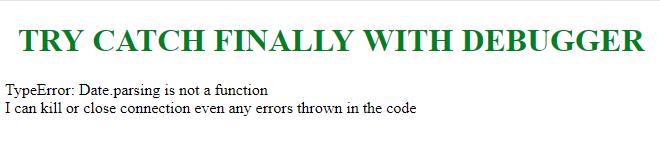
Final Output:
Explanation:
- When we press F12 and run the code then code moved to debugger mode as above.
- Once we click on step over the next function call or F10 then code moved from debugger to next line, keep on pressing until we figure out any errors.
- Here we encounter an error that is there is no predefined method name parsing().
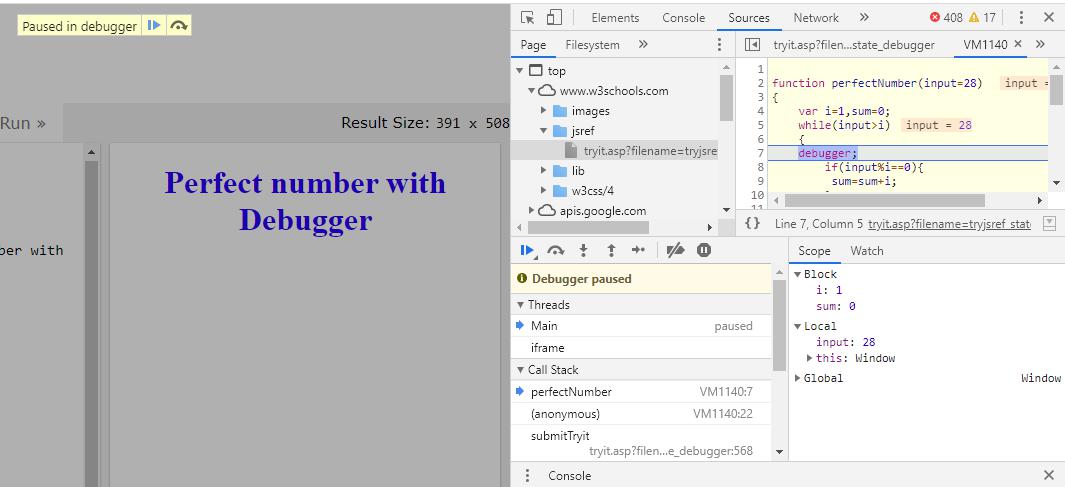
Example #4 – Perfect Number with Debugger Keyword
Code:
<!DOCTYPE html>
<html>
<body>
<font color="blue">
<h1 align="center">Perfect number with Debugger</h1>
</font>
<script>
function perfectNumber(input=28)
{
var i=1,sum=0;
while(input>i)
{
debugger;
if(input%i==0){
sum=sum+i;
}
i++;
}
if(sum==input)
{
document.write(input+" is perfect number");
}
else
{
document.write(input+" is not perfect number");
}
}
perfectNumber();
</script>
</body>
</html>
Output paused at debugger:
Final Output:

Explanation:
- When we press F12 and run the code then code moved to debugger mode as above.
- Once we click on step over the next function call or F10 then code is moved from debugger to next line, keep on pressing until we figure out any errors.
- If no errors are encountered, then code automatically comes out of the debug mode prints the output.
